CPAP Data Interpretation
Contents
Contents
Introduction
- This article and associated pages discuss the interpretation of data created by CPAP machines (of all types) and viewed using suitable software. Although the principles are software-independent, for convenience we will base the discussion on OSCAR. However much of what is discussed in these pages will also apply to ResScan, Encore, Prisma TS and other apnea software.
- For details of the OSCAR program, see OSCAR Help.
- Acknowledgement: Much of the material in this help system has been taken and/or adapted from RobySue's Beginner's Guide to SleepyHead
Events – Apnea, Hypopnea etc
Event flag graph and events table
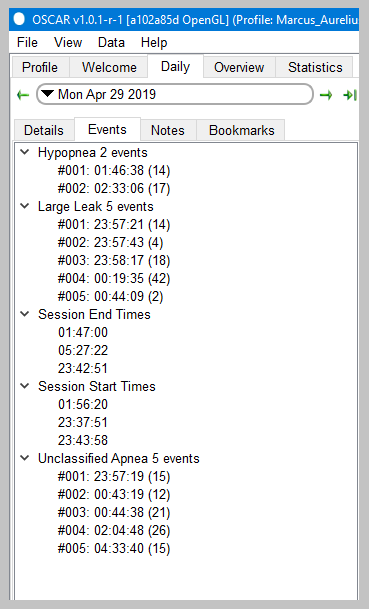
Events such as apneas, hypopneas, large leaks and other are shown in three ways in OSCAR:
- The events table is accessed via the Events tab in the left side bar of the Daily page. It will list every occurrence of an apnea and other events, together with the time they occurred and the duration in seconds. The various sub-headings can be expanded. Click on any event to go to that same event in the graphs.
- The Events graph is normally the top-most graph on the Daily page, and shows each event as a vertical stroke. When zooming in on the other graphs, the Events graph will remain as is, with the zoomed in part of the night highlighted on the events graph. So it also provides a useful reference tool for being able to quickly put the zoomed in graphs into the context of the whole night.
- Events can also be shown on the Flow Rate graph and other graphs.
- The event index (ie number per hour) is shown in the left sidebar.

|
 |
Flow rate graph
Beyond AHI: Apneas and hypopneas in the flow rate graph
Snoring
Flow limitations
Machine reaction to events
Pressure
Leaks
- OSCAR leaks
- Leak Rate Graph: A closer look
Other parameters

Donate to Apnea Board

