Difference between revisions of "OSCAR Organization - Daily data window"
(→Pie Chart) |
(→The daily detailed graphs) |
||
| Line 61: | Line 61: | ||
<br> | <br> | ||
| + | |||
| + | == Tabs: Details, events, notes and bookmarks == | ||
| + | * The '''Details tab''' is the default view which shows the statistics, machine settings etc. | ||
| + | * The '''Events tab''' Shows every apnea, hypopnea, large leak and other significant events during the night. The numbers in brackets are the duration of the event in seconds. Clicking on any event will zoom the chart to show that event in detail. [[File:OSCAR Events tab.PNG]] | ||
| + | * The '''Notes tab''' allows you to keep a daily journal of your sleep experience. There are basic formatting buttons available as well as a slider to register how you feel (on a scale of Zombie to Awesome). You can also enter your weight each day. | ||
| + | * The '''Bookmarks tab''' lets you record the time of significant events you may wish to refer back to, such as an exceptionally long apnea. Place the cursor on the event, zoom in as far as possible, then click '''Add Bookmark'''. Bookmarks can be searched using the Bookmarks tab in the right side-bar (press F10 to make the side-bar visible). | ||
== The daily detailed graphs == | == The daily detailed graphs == | ||
Revision as of 01:13, 3 June 2019
|
Afrikaans /
في الصفحة /
български /
中国 /
臺灣 /
čeština/
Dansk /
Deutsch /
Ελληνικά /
Español /
Filipino /
Français /
עברית /
Magyar /
Italiano /
日本語 /
한국어 /
Nederlands /
Norsk /
Polskie /
Português /
Română /
Pусский /
Suomalainen /
Svenska /
ภาษาไทย /
Türkçe |
Contents
OSCAR Help
This guide is part of the suite of OSCAR help articles. See OSCAR Help.
Acknowledgement: Most of the material on this page has been sourced from [RobySue's Beginner's Guide to SleepyHead]
Introduction
This page explains in detail the OSCAR Daily screen.

Left side-bar

|
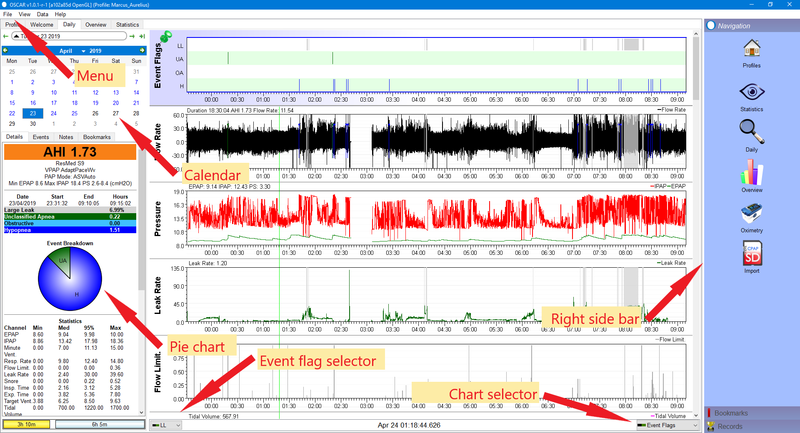
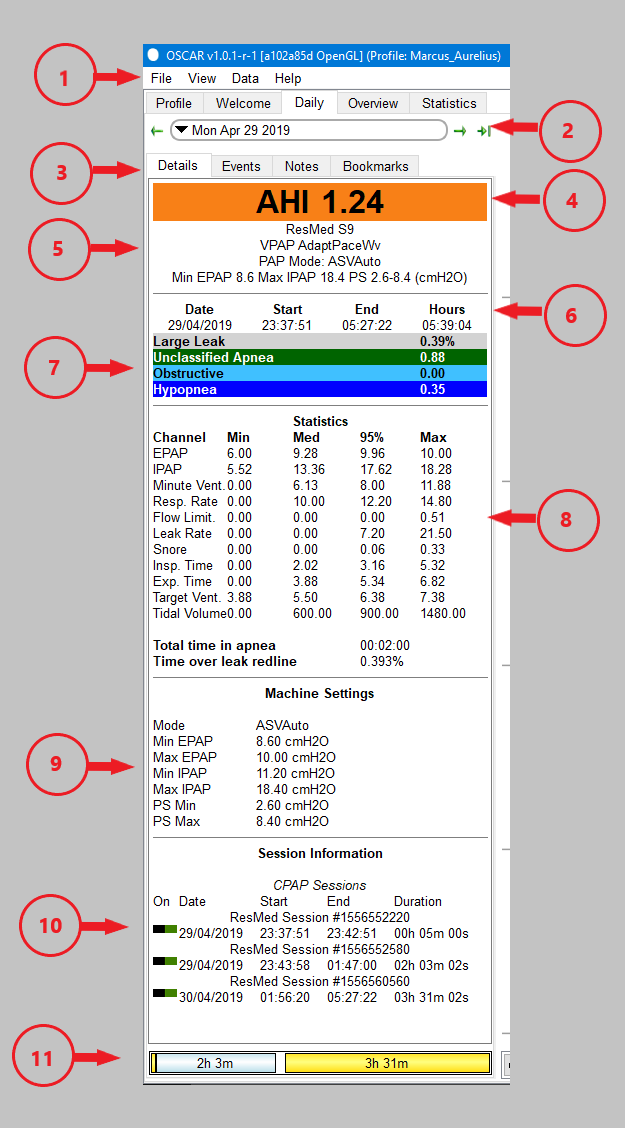
The left part of the Daily screen is referred to as the 'left side-bar. It contains details of your machine and its settings, your AHI and other sleep indicators, and the amount of time you were asleep.
|
The Calendar
Pie Chart
Tabs: Details, events, notes and bookmarks
- The Details tab is the default view which shows the statistics, machine settings etc.
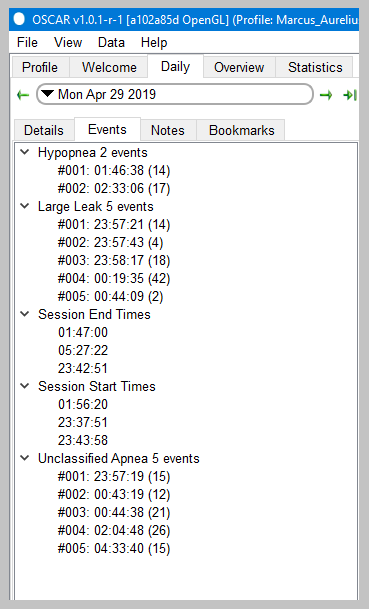
- The Events tab Shows every apnea, hypopnea, large leak and other significant events during the night. The numbers in brackets are the duration of the event in seconds. Clicking on any event will zoom the chart to show that event in detail.
- The Notes tab allows you to keep a daily journal of your sleep experience. There are basic formatting buttons available as well as a slider to register how you feel (on a scale of Zombie to Awesome). You can also enter your weight each day.
- The Bookmarks tab lets you record the time of significant events you may wish to refer back to, such as an exceptionally long apnea. Place the cursor on the event, zoom in as far as possible, then click Add Bookmark. Bookmarks can be searched using the Bookmarks tab in the right side-bar (press F10 to make the side-bar visible).
The daily detailed graphs
These are the graphs that the experienced forum members keep referring to when they ask for more specific information about what your graphs look like.
Here's a close up of the top of the graphical data:
The top chart is the Events chart. The Events chart gives a snapshot of just how good or bad the night was. (This patient had a really good night on this night). In SleepyHead 0.9.5 and 0.9.6, this chart is pinned to the top of the detailed data graphs and it will NOT scroll out of view when you scroll down to look at more graphs. It's best to leave the Events chart pinned since it serves as a navigation guide: The Events chart does not zoom in with the rest of the graphs.
The Flow Rate graph is often called the wave flow data. When you zoom in on this graph you can see a trace of every breath you took all night long.
The labels on the rest of the graphs are self-explanatory once you know the jargon. This is discussed later in this article.
Scrolling down reveals additional daily data graphs:
The particular graphs that you will see in OSCAR depends on the machine you are using and whether you have turned any of the available graphs "off". This is discussed later in this article as well.

Donate to Apnea Board


