OSCAR Daily screen
From Apnea Board Wiki
|
Afrikaans /
في الصفحة /
български /
中国 /
臺灣 /
čeština/
Dansk /
Deutsch /
Ελληνικά /
Español /
Filipino /
Français /
עברית /
Magyar /
Italiano /
日本語 /
한국어 /
Nederlands /
Norsk /
Polskie /
Português /
Română /
Pусский /
Suomalainen /
Svenska /
ภาษาไทย /
Türkçe |
Contents
OSCAR help
This guide is part of the suite of OSCAR help articles. See OSCAR Help.
Introduction
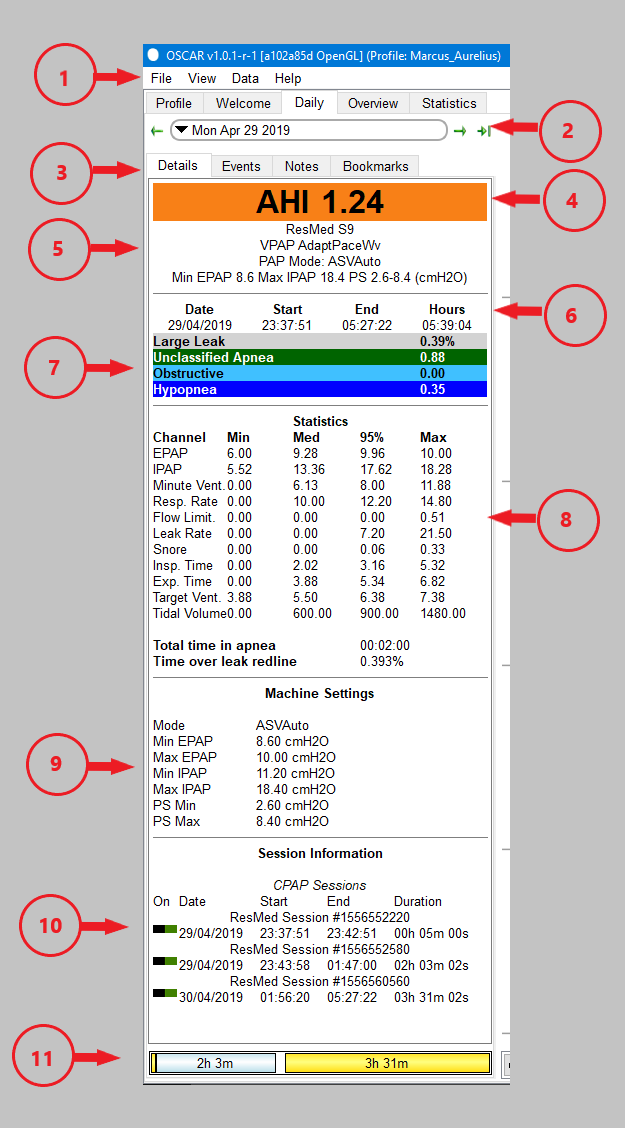
This page explains in detail the OSCAR Daily screen and how to interpret the data on that screen.
Left side-bar

|
The left part of the Daily screen is referred to as the 'left side-bar. It contains details of your machine and its settings, your AHI and other sleep indicators, and the amount of time you were asleep.
|
Tabs: Details, events, notes and bookmarks
- The Details tab is the default view which shows the statistics, machine settings etc.
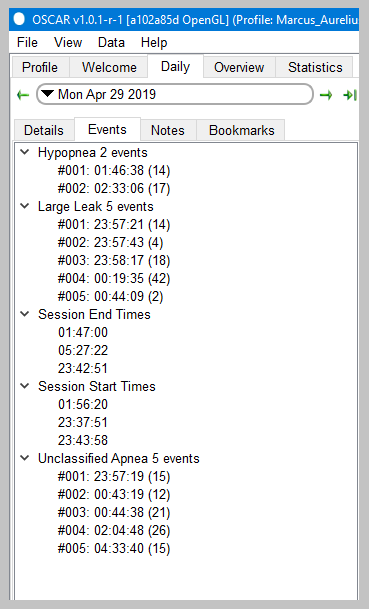
- The Events tab Shows every apnea, hypopnea, large leak and other significant events during the night. The numbers in brackets are the duration of the event in seconds. Clicking on any event will zoom the chart to show that event in detail.
- The Notes tab allows you to keep a daily journal of your sleep experience. There are basic formatting buttons available as well as a slider to register how you feel (on a scale of Zombie to Awesome). You can also enter your weight each day.
- The Bookmarks tab lets you record the time of significant events you may wish to refer back to, such as an exceptionally long apnea. Place the cursor on the event, zoom in as far as possible, then click Add Bookmark. Bookmarks can be searched using the Bookmarks tab in the right side-bar (press F10 to make the side-bar visible).
Important Daily Detailed Graphs
          4.3.1 The Events Table
          4.3.2 The Flow Rate graph
          4.3.3 The Pressure graph
          4.3.4 The Leak Rate graph
          4.3.5 The Snore graph
          4.3.6 The Flow Limitation Graph
          4.3.7 ALL OTHER GRAPHS
Advanced OSCAR graphs
The Flow Rate graph---a detailed look
          4.5.1 Inspiration Expiration Ratio (I:E Ratio)
          4.5.2 Robysue's Flow Rate Interpretation from Forum Posts
The Pressure graph---a detailed look
4.6.1 Common concerns that people have about their Pressure graph
Leak Rate Graph---a detailed look
          4.7.1 Defining Large Leaks
          4.7.2 Part II: Are my leaks bad enough to worry about?
              4.7.2.1 Great, Good, and Decent Enough Leak/Total Leak lines
              4.7.2.2 Problematic Leak/Total Leak Lines
              4.7.2.3 Bad and Horrible Leak/Total Leak Lines
The AHI Graph

Donate to Apnea Board
